Misleading Power Factor at 0.95
Why You May Still Need Power Factor Correction – Even if Your Meter Shows 0.95
Introduction
Many factories check their electricity bills or total power meter and see a sitewide power factor (PF) of 0.95 or better and assume they don’t need any further correction. In some cases, this may be so, but on larger sites this can be misleading.
A site can have poor-performing sections hidden within the overall average. These low PF pockets waste capacity and increase current draw, even if the main meter looks fine.
To illustrate this, I have done a case study based off an actual site we visited recently, that showed .95-.98 PF at the Main Switchboard. I have rounded out decimal points for ease of reading, so if you take the time to do the maths, you’ll possibly get slightly different answers.

Case Study
In our example, one distribution board (DB1) feeds a section of the plant that draws:
- 250 A at 400 V
- Real power: 122 kW
- Reactive power: 125 kVAr
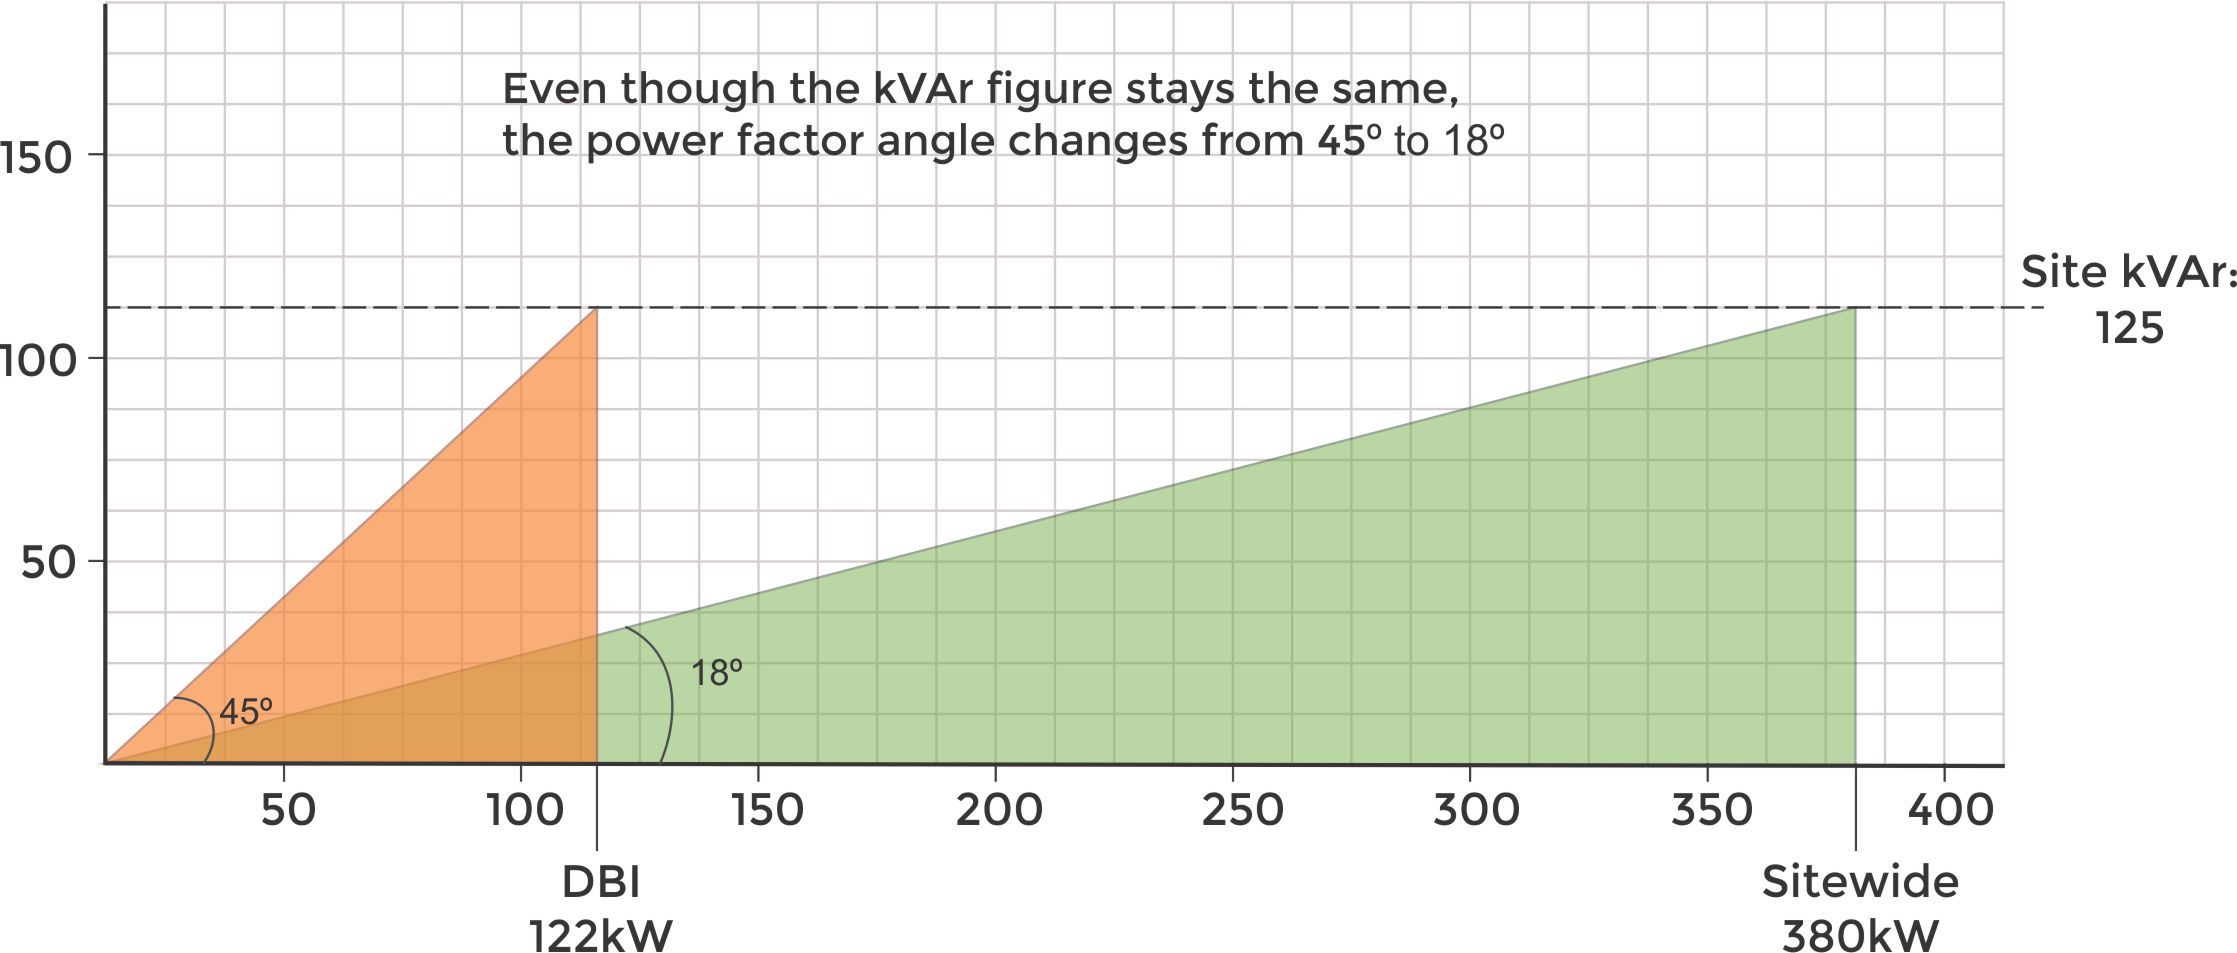
- Power factor: 0.7 (lagging, 45° angle)
On its own, this load is very inefficient. Yet when added to the rest of the site, which runs with a high PF, the overall site meter shows:
- Total real power: 381 kW
- Reactive power still around 125 kVAr
- Site Power factor = 0.95 (18° angle)
- Line current: 579 A
What This Means
Although the site appears efficient at 0.95 PF, the poor PF section is still forcing 125 kVAr of reactive current through the switchboard and cabling. The only reason the site looks “good” at the meter is because other high-PF loads dilute the ratio. The reactive current is still physically present, heating conductors and using capacity.
How Much Could Be Saved?
If this 125 kVAr were corrected locally (e.g., capacitor bank or SVG at the DB location), the site current would drop. At PF .99, the same 381 kW would draw around 550A
That’s a reduction from around 580A to 550 A, so a saving of about 5%. So you can see if the load was larger, the saving in copper losses, transformer loading, and spare capacity can be significant.
The Solar Aspect
With the cost of energy increasing in NZ and the cost of Solar panels, inverters and batteries reducing we’re seeing more and more sites around New Zealand adding solar generation.
It’s great for cutting electricity bills and is a nice thing to put on your corporate website, but it also changes how your revenue meter reports your power factor.
We've seen this beginning to be an issue here in New Zealand and talking with some of the power quality people over in Australia, this issue has already become common over there.
Basically, solar reduces the amount of real power (kW) you draw from the grid, but it does nothing to reduce the reactive power (kVAr) your equipment still needs.
That means the grid “sees” less kW but the same kVAr, so your revenue meter power factor looks much worse.
One good example is a large cool store complex that uses 400 kW and 125 kVAr which means they have a good Power Factor of 0.95. Over a period of a few years, they have covered nearly 2000m2 of their roof with Solar panels. On a good day they can generate slightly over 300kW to run their facility, which is really good for their power consumption stats, but they were seeing a massive spike in Power Factor charges.
The catch is, when the solar is generating well, the grid supplies just 100 kW of energy, but the full 125 kVAr, so the Power Meter is seeing a Grid PF of 0.63. Overall, the cool store is running quite efficiently at PF 0.95, but the power retailer can't see that, to them they see a small but very inefficient electrical load. This led to penalties and questions about site efficiency, when the real issue is simply that reactive power can’t be offset by solar.
The solution is local power factor correction (capacitor banks or active filters). Installing a 100 kVAr static var generator, that only needs to operate when solar is generating, lifts the sites PF from 0.63 back up to around 0.97.
With reactive power charges of $8–10K per year, that would pay off the SVG, install, and everything else to do with it in well under 18 months.
Conclusion
A sitewide PF of 0.95 does not mean every load is efficient.
Localised poor PF sections can still waste current, restrict future expansion and skew revenue meter readings.
Installing targeted power factor correction at those loads can reduce site current, free capacity, improve reliability, and reduce PF network charges.
Relying only on the power factor displayed at the main meter can be misleading. By looking deeper into your site’s load profile, you may find areas where local correction offers real savings, even if the utility isn’t charging penalties.